Plot the metaweb G according to the inferred coefficients
Source:R/plotG_inferred.R
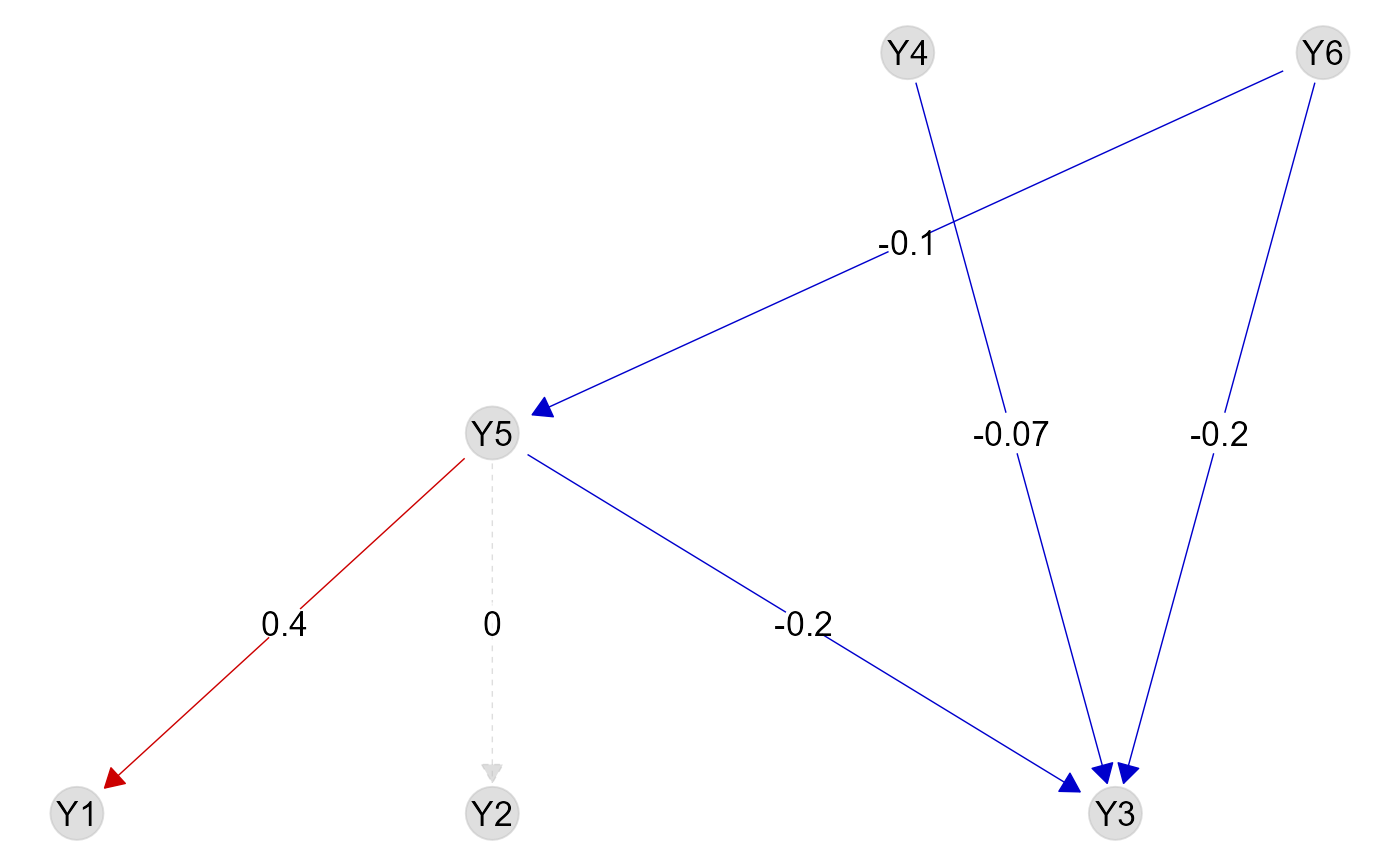
plotG_inferred.RdPlot the metaweb G with links colored accordingly to the inferred prey-predator regression coefficients of a fitted trophicSDM model. Plots the metaweb G, where each predator-prey link is colored according to whether the related regression coefficient if inferred as positive (in red), negative (in blue) or non-significant (dashed grey line) according to the confidence level specified in "level". Estimates of the significant standardised regression coefficients are pasted on the links. Only works if species are modeled as a function of their preys or predators without composite variables (i.e., the function only works if tSDM is fitted with sp.formula = NULL and sp.partition = NULL)
plotG_inferred(tSDM, level = 0.9)Arguments
- tSDM
A trophicSDMfit object obtained with trophicSDM()
- level
The confidence level used to decide whether regression coefficients are non-significant or not. Default to 0.9.
Value
A ggnet object
Examples
data(Y, X, G)
# define abiotic part of the model
env.formula = "~ X_1 + X_2"
# Run the model with bottom-up control using stan_glm as fitting method and no penalisation
# (set iter = 1000 to obtain reliable results)
m = trophicSDM(Y, X, G, env.formula,
               family = binomial(link = "logit"), penal = NULL,
               mode = "prey", method = "glm")
# \donttest{
plotG_inferred(m)

# }
# }