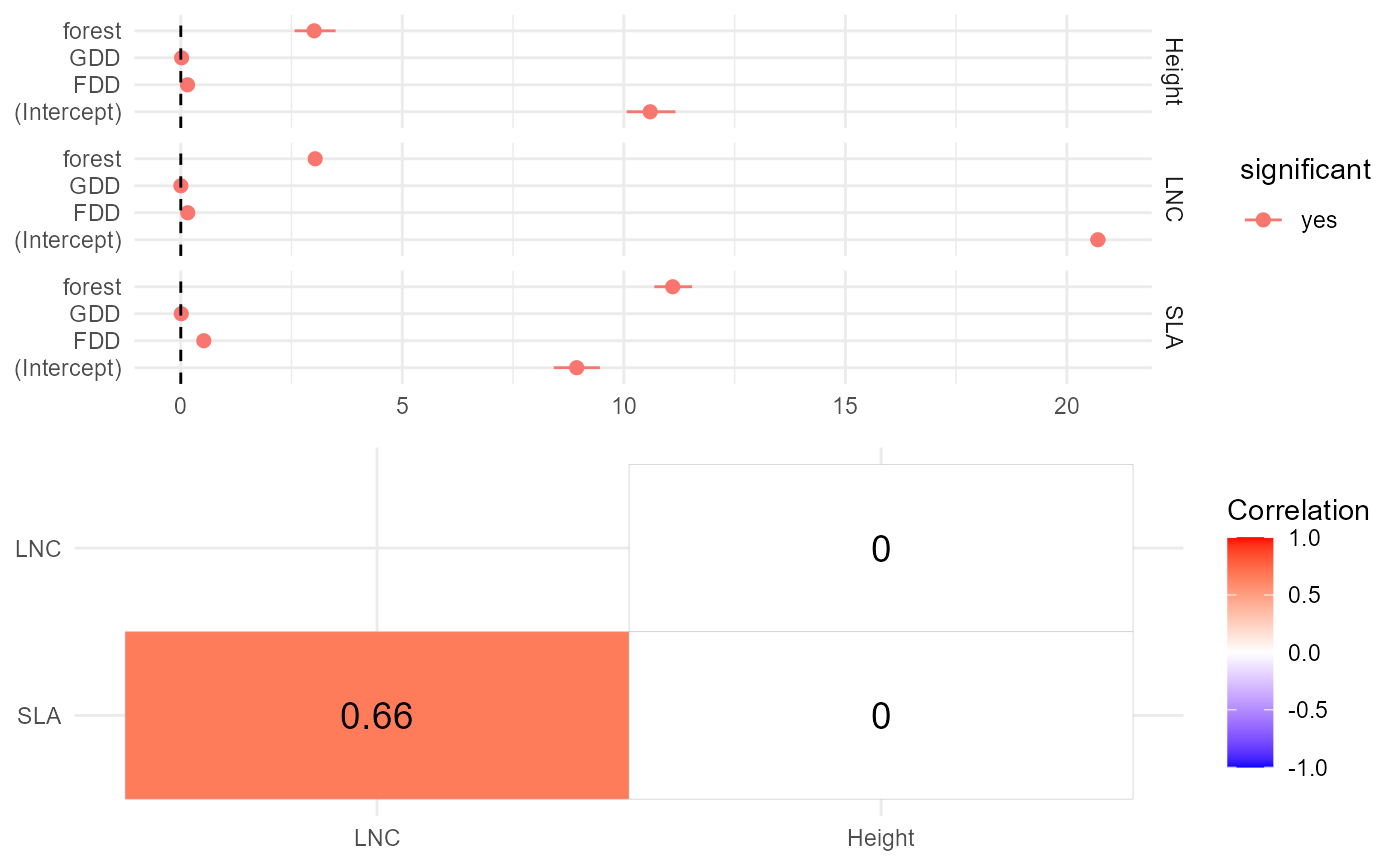
Plots the regression coefficients and covariance matrix of a fitted jtdm
# S3 method for jtdm_fit
plot(x, ...)
Arguments
- x
a model fitted with
jtdm_fit- ...
additional arguments
Value
A plot of the regression coefficients and covariance matrix of the fitted model
Examples
data(Y)
data(X)
m = jtdm_fit(Y=Y, X=X,
             formula=as.formula("~GDD+FDD+forest"), sample = 1000)
plot(m)